Pulse Edge Energy is developing smart metering and monitoring solutions that help consumers and energy operators understand consumption, track generation and respond to device issues.
Consumption and generation by hour — Demo site A (demonstration data) (kWh)
Hour
Generation (kWh)
Consumption (kWh)
00:00
0
8
01:00
0
7
02:00
0
7
03:00
0
7
04:00
0
8
05:00
0
10
06:00
2
13
07:00
9
15
08:00
22
16
09:00
36
16
10:00
48
16
11:00
56
17
12:00
60
17
13:00
57
16
14:00
50
16
15:00
38
16
16:00
25
17
17:00
12
19
18:00
5
23
19:00
0
26
20:00
0
25
21:00
0
21
22:00
0
15
23:00
0
9
The problem
Better decisions start with visibility.
When energy data sits across separate devices and systems, it is harder to understand usage, identify faults and support customers. Our focus is bringing the information that matters into a clearer view.
Understand usage
See how much electricity is used, when and where — per meter, per premises or across a site.
Compare supply and demand
Set generation from solar and other sources alongside consumption, where suitable meters or integrations provide the data.
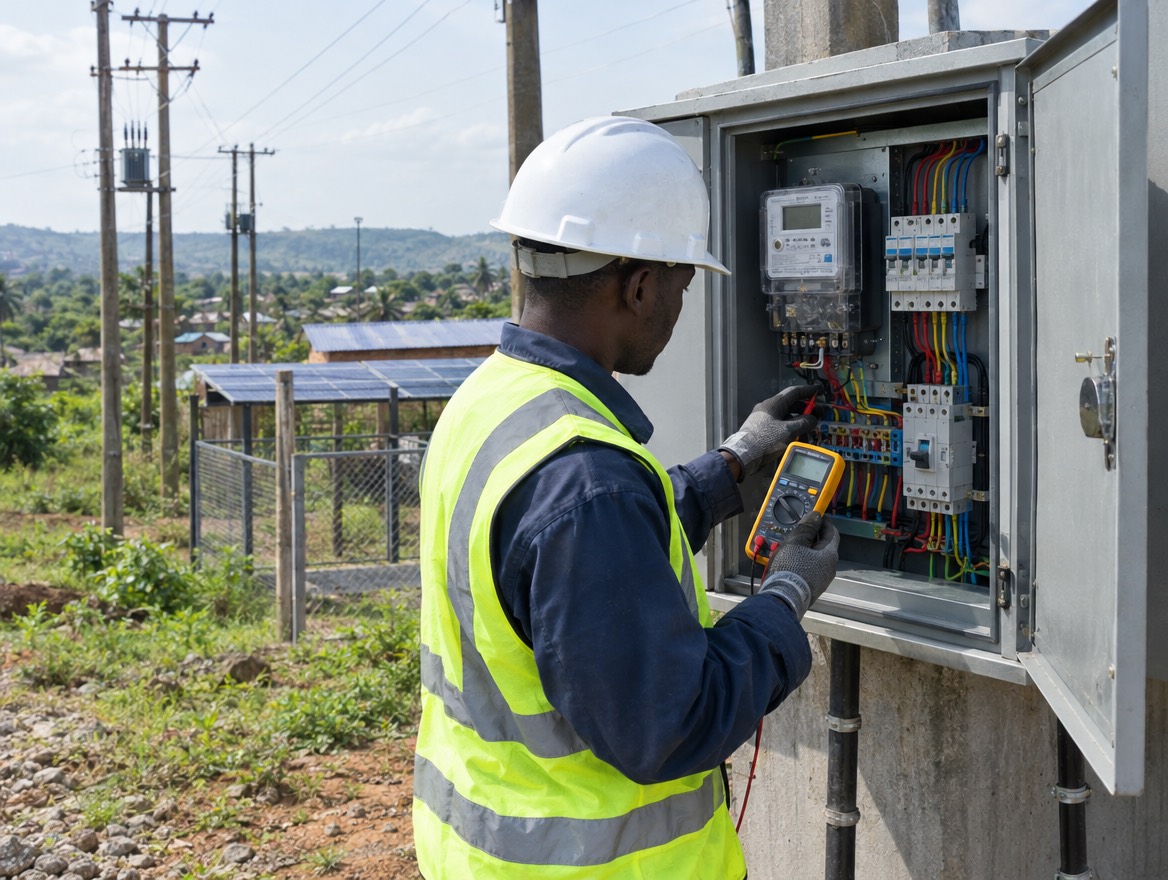
Identify issues earlier
Flag devices that stop communicating or report unusual readings, so problems can be investigated sooner.
Designed for local conditions
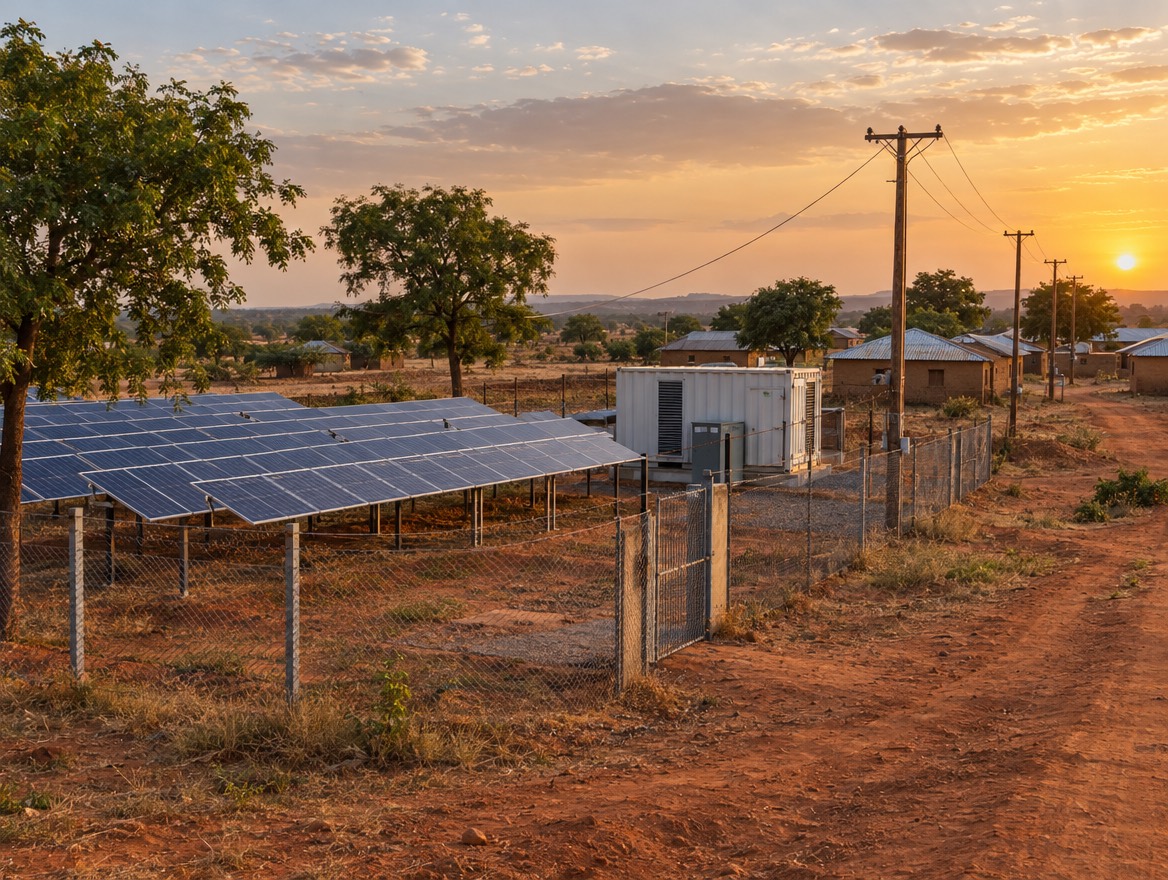
Built around how energy works in Nigeria
We are designing for the realities operators, estates and households deal with every day — not adapting a product made for somewhere else.
Prepaid first
Prepaid metering is common, so balances, units and low-credit alerts are central to the design.
Grid, solar and generator
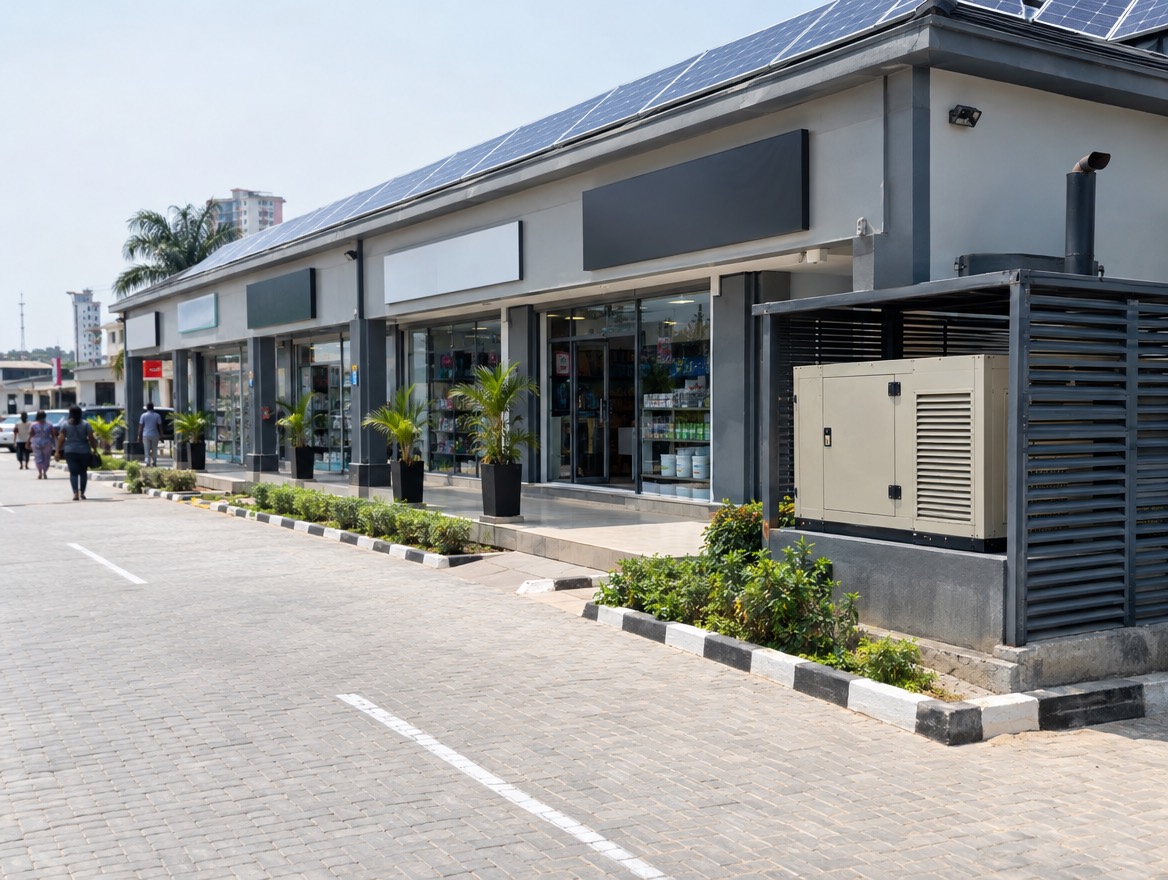
Many sites draw on several supplies. We aim to show each one clearly where it is metered.
Variable connectivity
Readings can arrive late. Every figure shows when it was last updated, and gaps stay visible.
Mobile and light
Most people will use a phone on mobile data, so our pages and previews are kept fast and lightweight.
Initial solution areas
Where we are starting
Three connected areas form our initial offer. Installation and hardware availability are subject to a site assessment and confirmed delivery arrangements.
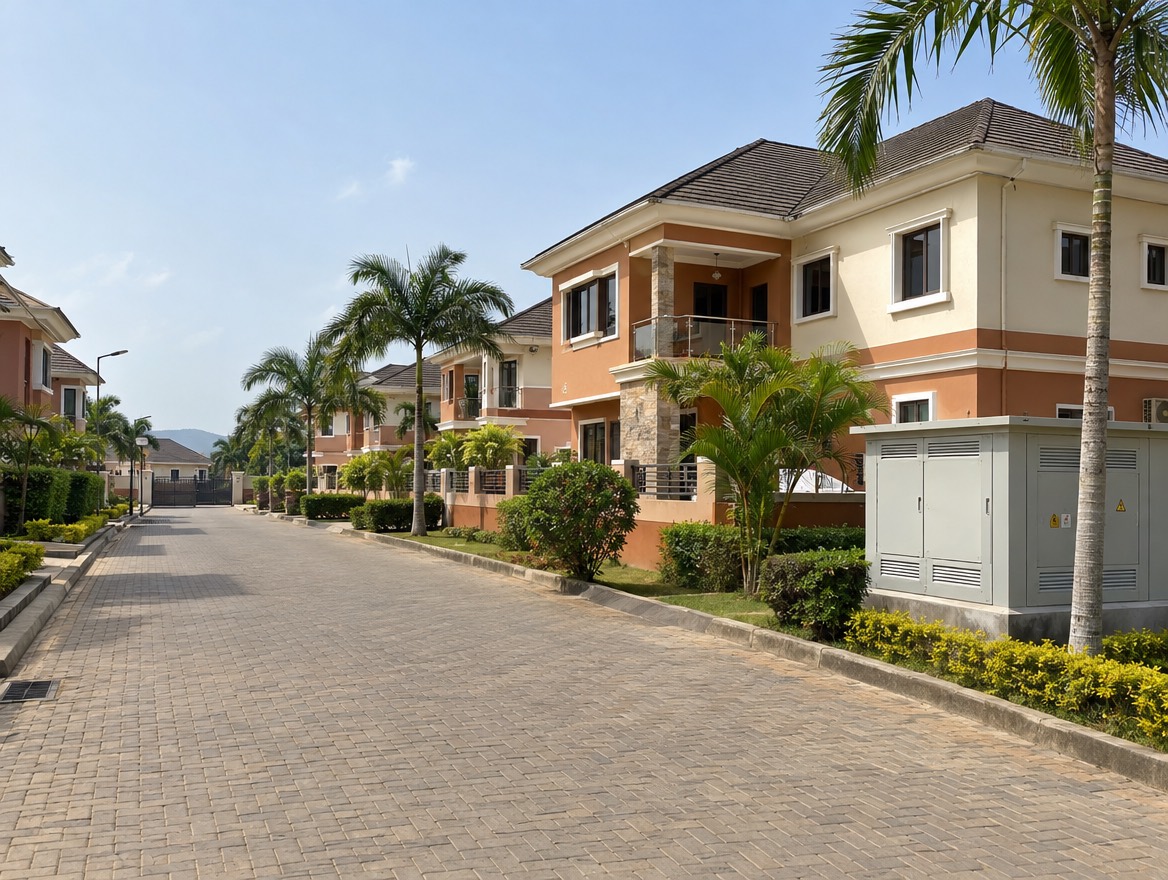
Illustrative image
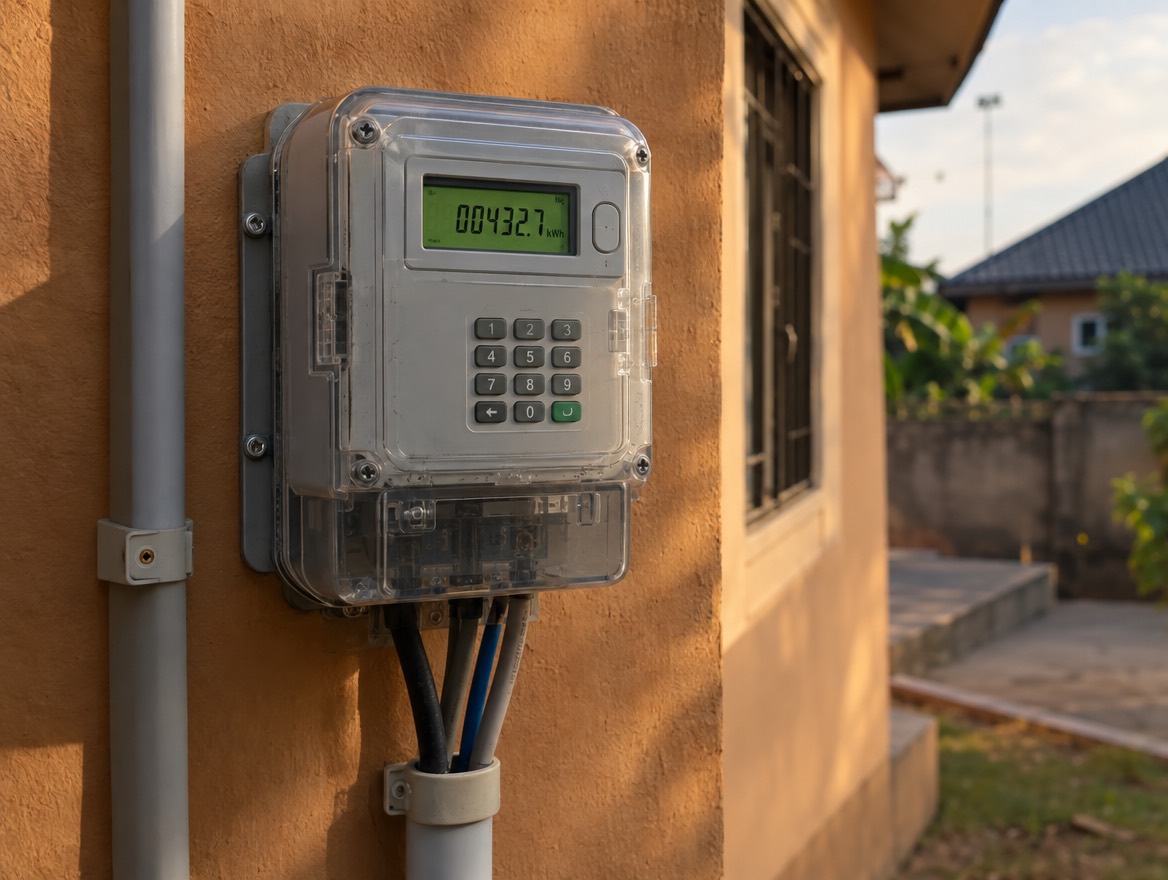
Smart metering
Metering that makes usage easy to see
Explore metering options for measuring consumption and making usage data easier to access.
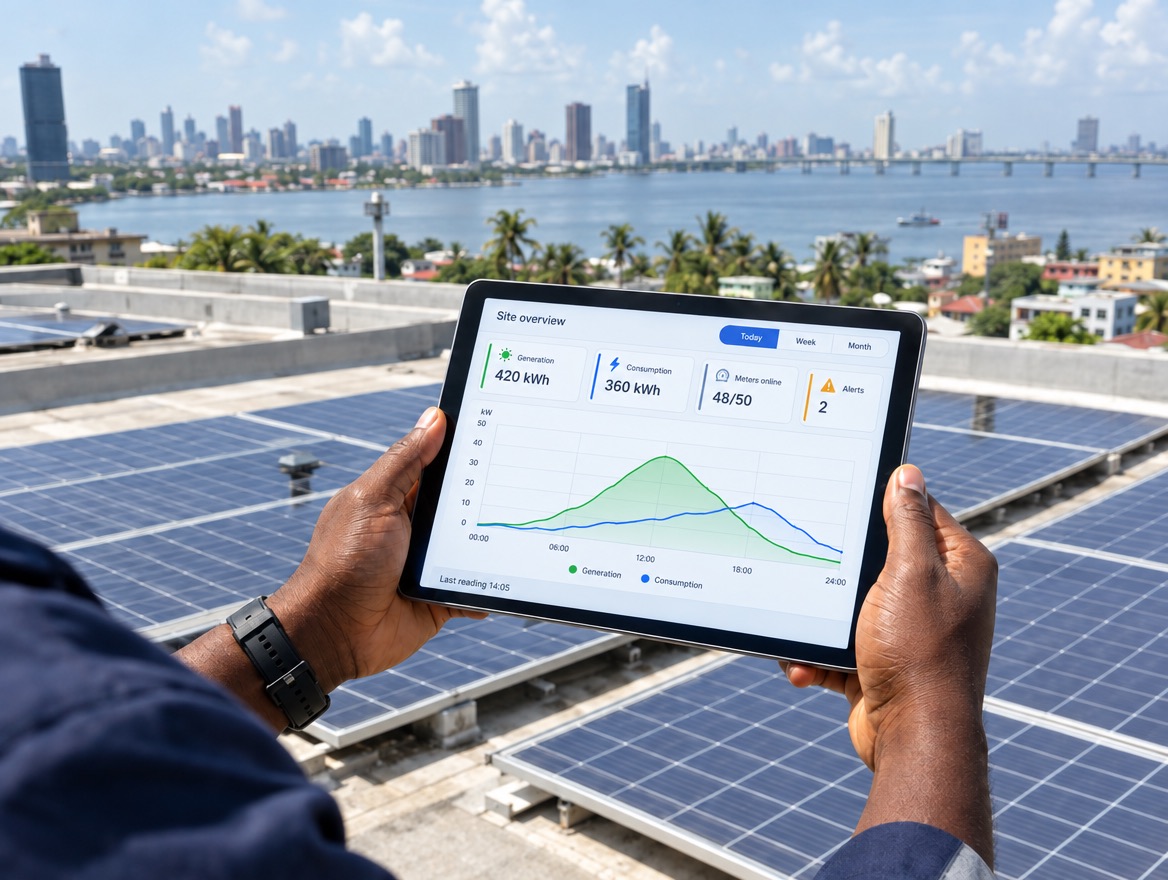
An illustrative example of the experience we are designing. All figures are demonstration data for a fictional site and household — not a live deployment.
Illustrative platform previewDemonstration data
Demo site A · today (fictional site)
Generation today
420 kWh
Consumption today
360 kWh
Meters communicating
48 of 502 offline
Open alerts
2Communication
GenerationConsumptionView chart data as a table
Consumption and generation by hour — Demo site A (demonstration data) (kWh)
Hour
Generation (kWh)
Consumption (kWh)
00:00
0
8
01:00
0
7
02:00
0
7
03:00
0
7
04:00
0
8
05:00
0
10
06:00
2
13
07:00
9
15
08:00
22
16
09:00
36
16
10:00
48
16
11:00
56
17
12:00
60
17
13:00
57
16
14:00
50
16
15:00
38
16
16:00
25
17
17:00
12
19
18:00
5
23
19:00
0
26
20:00
0
25
21:00
0
21
22:00
0
15
23:00
0
9
AssessingTwo meters not communicatingDEMO-INC-0107 · opened 11:55
Meters DEMO-M-031 and DEMO-M-044 have sent no readings since 11:40. Supply status is unknown: a meter that is offline is not necessarily without electricity.
All figures are arbitrary demonstration data, not a forecast or a customer result. The gap between generation and consumption is not a loss figure: storage, export, timing and meter placement all affect it.
Illustrative consumer previewConcept · demonstration data
Demo household (fictional account)
Prepaid balance
38.5 kWhWhere the meter supports it
Used today
6.4 kWhAs at 16:30
Average daily use
9.9 kWhLast 7 days
Daily use — last 14 days
Planned feature Example low-credit notification
“Your balance is 38.5 kWh, below your alert level of 40 kWh. At your recent average use this is about 4 days of electricity.”
Estimate assumes use continues at the average of the last 7 days (9.9 kWh per day). Actual duration depends on how much electricity you use.
Concept preview with fictional figures. It does not connect to a meter or create an account.
Switching views changes the sample content only. It does not create an account or connect to a meter.
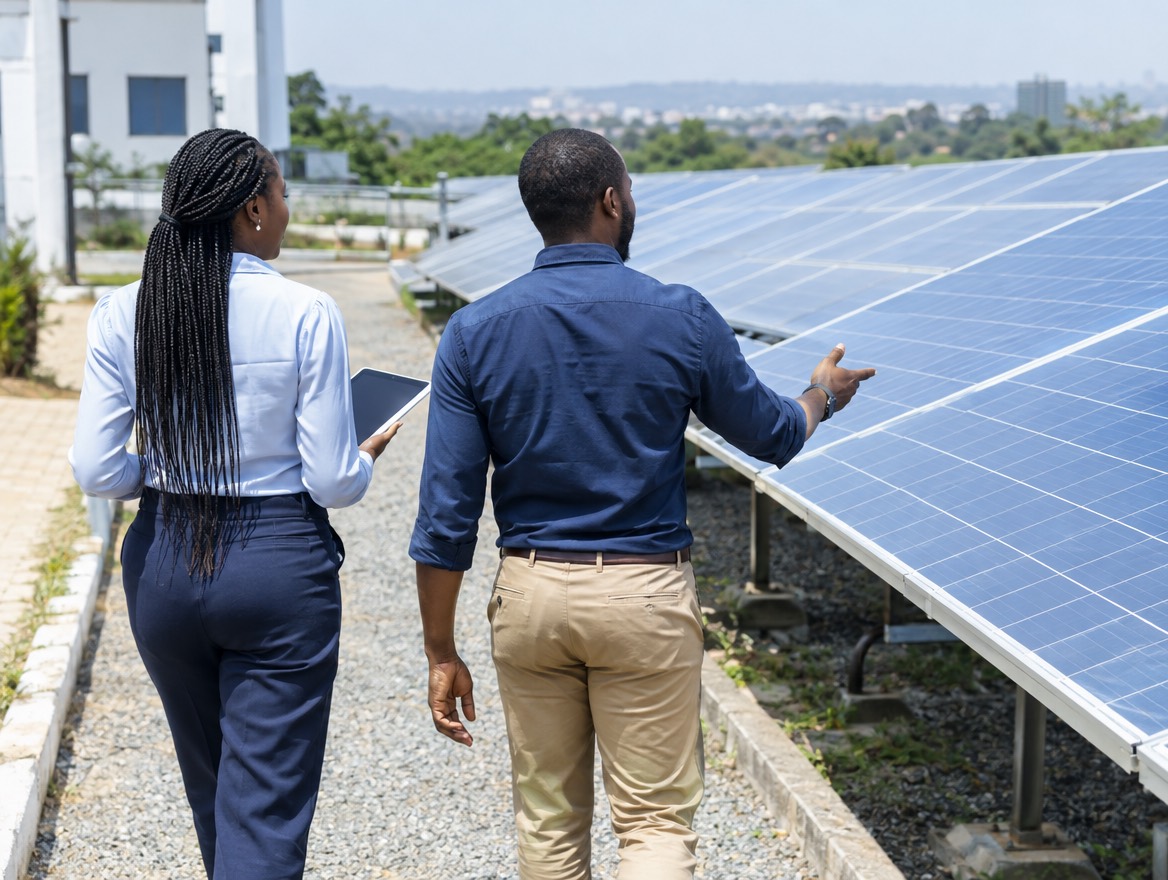
Illustrative image
Pilot partners
Help shape a better energy monitoring experience.
We are looking to speak with RESCOs, estates and businesses about their metering, monitoring and support needs. Discuss a potential pilot and help us prioritise the capabilities that matter in practice.